Presentations of data such as those in Figure 1 (representing 50 unvaccinated and 40 vaccinated admissions per week in the ICUs of a region) accompanied by headlines such as "44.4% of covid patients admitted to ICU were vaccinated" (or its complementary "55.6% of patients admitted to ICU were not vaccinated") are not unusual. This type of statement raises doubts when, sometimes inadvertently, we try to make causal inferences about the effectiveness of vaccines.
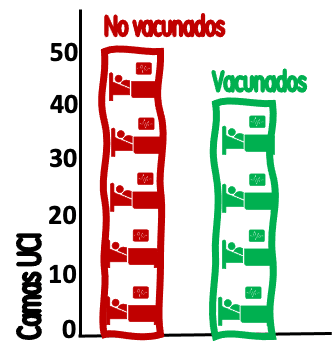
These hospitalization figures, without being false, distort reality and affect the rationality of our judgment on the effectiveness of vaccines against covid. They have two major problems: the information they provide is poorly "framed" and Simpson's paradox.
The framing effect is a cognitive bias that modifies our preferences, making them less rational, according to the way in which the information is presented ("framed"). The concept was introduced by Nobel Prize winners Kahneman and Tversky and can be illustrated with one of their best known experiments.
Very simplistically, participants were given a choice between a hypothetical treatment for 600 patients with a serious disease that would save 200 of them, versus another hypothetical treatment that would kill 400. Although the two alternatives are identical (in both cases 200 people survive and 400 die), most participants preferred the life-saving, positively "framed" treatment.
In the hypothetical example in Figure 1, the framing is negative simply because it does not consider that the source population of these admissions (the number of vaccinated and unvaccinated patients in the region) is very different.
Continuing with the example, our ICUs have 90 weekly covid admissions, 40 in vaccinated (40*100/90 = 44.4 % of admissions are vaccinated) and 50 in unvaccinated (50*100/90 = 55.6 % of admissions are unvaccinated). Let us now add that the population of the region served by these ICUs is 5.5 million people over 12 years of age.
The total rate of ICU admissions would be (90*100,000/5,500,000 =) 1.6 admissions per 100,000 people over 12 years of age per week. But this combined figure of vaccinated and unvaccinated, which is sometimes reported in official statistics, does not provide much information on the risk of ICU admission of the vaccinated and unvaccinated.
Let's add more data. Let's say that 91 % of the population >12 years (5.5*0.91=5 million) is vaccinated, while the remaining 9 % (500,000) is not. With these data we can now provide better framed information (Figure 2): The 500,000 unvaccinated have generated 50 ICU admissions/week, with a rate of (50*100,000/500,000) 10 admissions per 100,000 unvaccinated per week. The 5 million vaccinated have generated 40 admissions, with a rate of (40*100,000/5,000,000) 0.8 ICU admissions per 100,000 vaccinated.
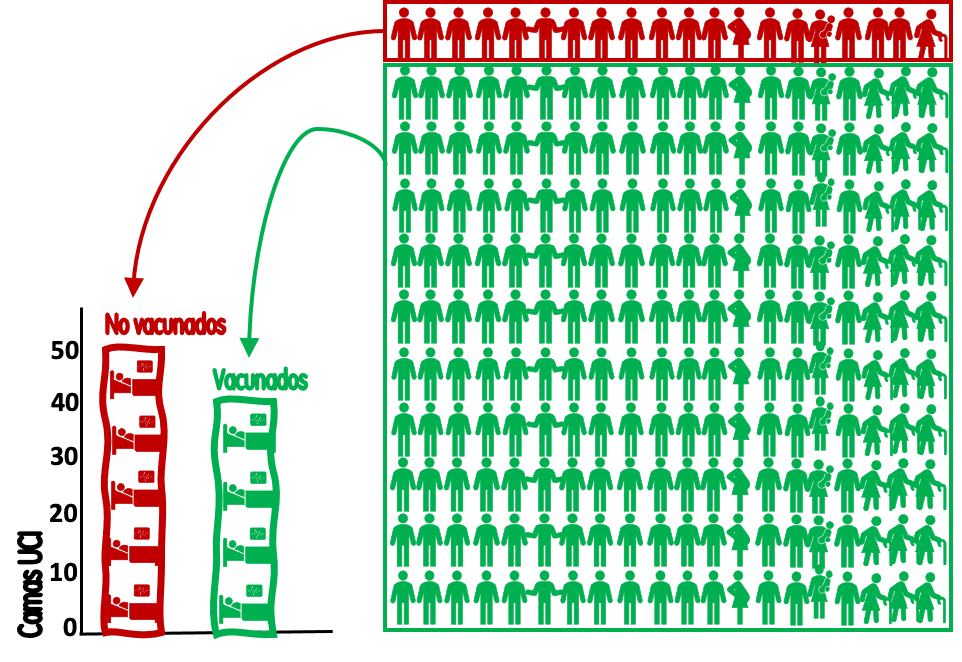
Figure 2. ICU admissions/week for covid-19 patients in vaccinated and unvaccinated population. Each bed represents 10 admissions; each human figure represents 25,000 inhabitants / Salvador Peiró.
These population-based rates, separated by groups, already inform vaccinated and unvaccinated patients of their difference in risk of admission to the ICU each week: 12.5 times more (1,150% more in relative terms) and offer better "framed" information for decision making that confusingly transfers the idea that these risks were shared half and half. These data, population rates and relative risks (and not the proportion of persons admitted), are what matter to inform rational preferences about vaccination.
Recall that, at the extreme, if 100% of the region's inhabitants were vaccinated, all ICU admissions would come from this population. The big difference would be that the 500,000 previously unvaccinated would have produced only 4 admissions/week (0.8/100,000; 12.5 times less than the 50 in the example) and only a total of 44 people would have been admitted to the ICU that week instead of 90 (Figure 3).
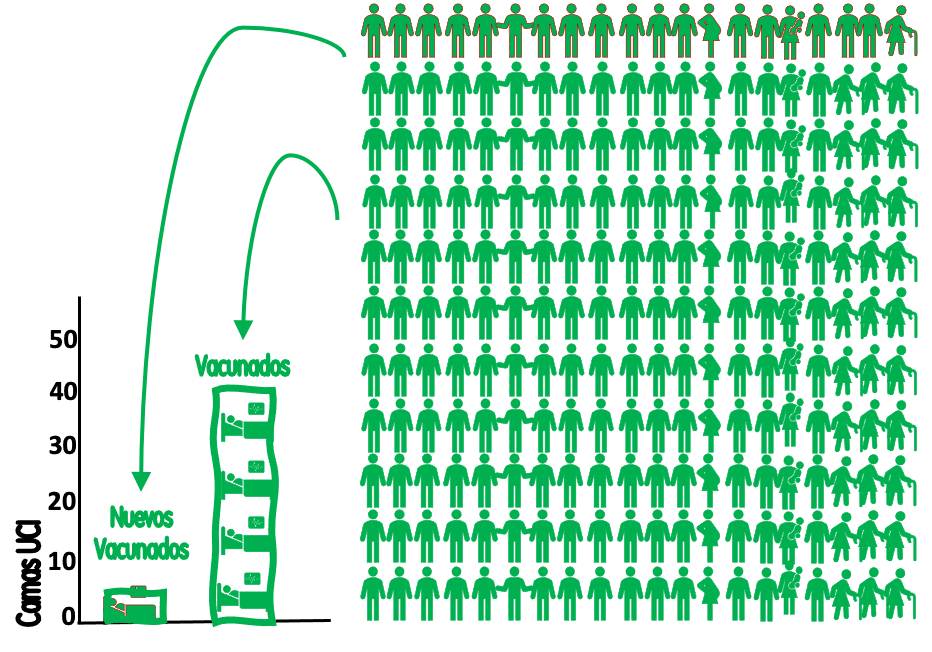
Figure 3. ICU admissions/week for patients with covid-19 if the entire population were vaccinated. Each bed represents 10 admissions; each human figure represents 25,000 inhabitants. / Salvador Peiró.
Age, severity, vaccination rate and Simpson's paradox
The "framing effect" is not the only problem with the current presentation of rates when we want to make causal interpretations based on the incidence of severe cases (hospitalizations, ICU admissions, deaths) and vaccination. There is also an important confounding created by the higher incidence of severe covid in older people (compared to younger people) and the fact that these people have been vaccinated in a higher proportion than younger people.
In 1951, Edward H. Simpson described the statistical paradox that will help us understand what happens in some cases where, apparently, hospitals or ICUs have more vaccinated than unvaccinated patients.
Simpson's paradox is a phenomenon that occurs when in the general population there is a trend (in the example of Figure 4: the more vaccination, the higher the rate of ICU admissions) that disappears or is reversed when the statistical analysis is stratified by groups.
In the example in the figure, when stratifying by age, the trend is reversed and the higher the vaccination, the lower the rate of covid admissions within each age group. In other words: the vaccinated have a higher incidence of severe cases not because they are vaccinated, but because they are older; but within each age group the vaccinated have a lower incidence of severe cases than the unvaccinated.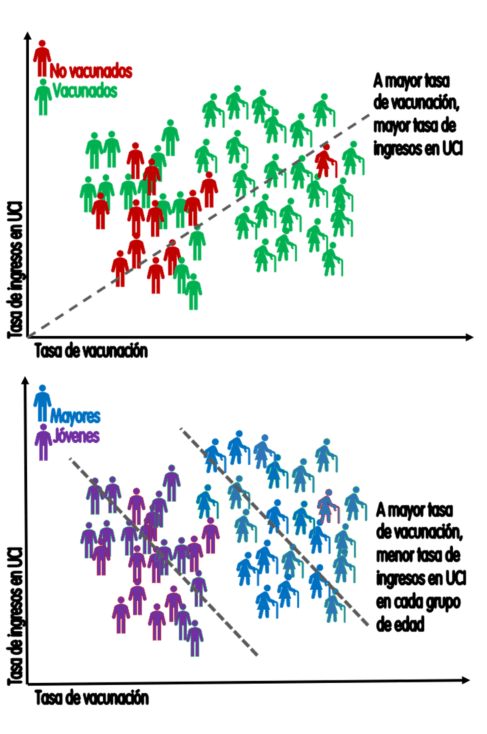
Figure 4. Simpson's paradox: the more people vaccinated, the more admissions in the total population, but less when stratified by age. Each bed represents 10 admissions; each human figure represents 25,000 inhabitants. / Salvador Peiró.
What Simpson's paradox teaches when reporting vaccination preferences is that, if not stratified by age, severe cases in vaccinated people will be overrepresented because there is a higher proportion of older people vaccinated and, in turn, older people have an increased risk of developing severe covid.
Current information on covid-19
Although all the indicators we use around covid have their indication, throughout the pre-vaccination period we have been using mainly 2 types: the cumulative incidence of new cases in 14 days (because it informed trends and was associated with a significant number of hospitalizations) and indicators of hospital or ICU capacity (because they informed our ability to care for patients and prepare for overcrowding situations).
After the mass vaccination of more than 80% of the population, both indicators have changed (but not lost) their interest in favor of others. On the one hand, the 14-day cumulative incidence data has been dissociated from what really matters: the severe covid data. Thanks to vaccines, and above all to the vaccination of people at higher risk (over 60 years of age and some groups), transmission no longer causes as many hospitalizations, ICUs and deaths as in the first waves. On the other hand, and due to this reduction in the incidence of severe cases, we do not expect saturation of hospitals or ICUs.
We are facing a period in which the most relevant measures become the cumulative incidence of cases in the elderly (because this is where the serious cases are generated, even in a lower proportion than before vaccination) and the incidence of new hospitalizations in vaccinated (which, despite being less than 10% of those over 12 years of age, generate half of the admissions) and unvaccinated patients. It is not that the other indicators are not useful, but in order to transmit an adequately "framed" image of the situation and to decide on potential non-pharmacological measures, these would be the most important.
In this sense, the best way to represent the relevant information around covid at present is probably along the lines of that employed by the US Centers for Disease Control and Prevention (CDC), separating the rates of new hospitalizations into vaccinated and unvaccinated, and stratifying them by age (Figure 5).
Possibly, aggregate transmission rates and the percentage of occupied beds were very important indicators to guide public health actions in the stages prior to mass vaccination. Also, possibly, times have changed and it is time to change the indicators.
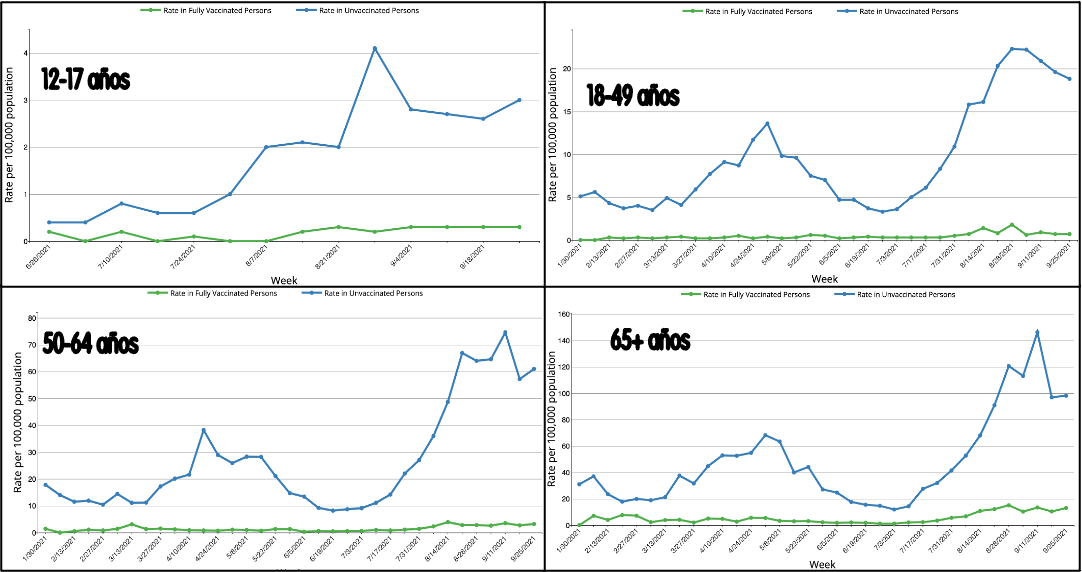
Figure 5. Weekly hospital admission rates in vaccinated and unvaccinated patients in the United States. Each bed represents 10 admissions; each human figure represents 25,000 inhabitants. / Salvador Peiró.
Salvador Peiró is an epidemiologist and researcher in the Health Services and Pharmacoepidemiology Research Area of the Foundation for the Promotion of Health and Biomedical Research of the Valencian Community (FISABIO), Valencia.
