
Reading a paper is a daily task in science journalism. It is not easy, as it is necessary to know its structure and to bear in mind that there are different types of studies. In addition, you have to learn how to analyse the numbers. Before starting, there is some good news: it is not necessary to be a mathematician or to have studied statistics to have certain notions that help to understand a study and, above all, to detect its limitations and possible errors.
1. What does this study ask?
Every paper attempts to answer one or more questions. Understanding this is important because the statistical analyses will be aimed at answering it. It is this question, and no other, that the study allows (at best!) to answer with more or less certainty.
For example, if a study analyses whether the measure of forcing children to wear a facemask in class has reduced the transmission of covid-19, it will not be able to answer other questions beyond the effectiveness of the policy. Its results will not be able to conclude whether facemasks work from a physics point of view, which type of facemask is best, whether the requirement worked in other ages or settings, or whether children wear them correctly.
2. Does anyone know what the p-value is?
It is a difficult concept to explain and understand, despite its ubiquity in the scientific literature. The p-value is defined as the probability that the observed effect is due to chance alone. For example, that the observed differences in mortality between a group of patients receiving a drug and a group of patients receiving a placebo are purely coincidental.
If this value is greater than 0.05, the observed effect is considered "likely" to be due to chance, and the result is considered "statistically insignificant". Otherwise, if the p-value is less than 0.05, it is considered "likely" that the observed effect is not due to chance and the result is considered "statistically significant".
More important than understanding the p-value is knowing what it does not mean: it does not mean that the conclusions of the study are true or that the results are correct. A study can be full of low p-values and still be completely wrong if other factors such as confounding factors have not been taken into account.
3. Confidence intervals
The values obtained by a study - for example, that a vaccine is 60% effective - are not an absolute truth, but a statistical approximation of the truth. Like any approximation, there is an unavoidable margin of error. This is known as the confidence interval, which is defined as the range of possible values around the observed value that will contain the true value 95 % of the time.
Knowing this interval is very important for assessing the quality of the result. It is not the same for a vaccine to have an efficacy of 60 % (30 % - 91 %) as it is for a vaccine to have an efficacy of 60 % (58 % - 62 %). In the first case, the uncertainty is greater and the vaccine may be much more or much less effective.
4. Beware of subgroups
The size of the sample used in a study is never a guarantee of its quality, but it is true that it can help to achieve some statistical robustness. This is why drugs start out being tested in a few human subjects, but end up being studied in large clinical trials involving thousands of people.
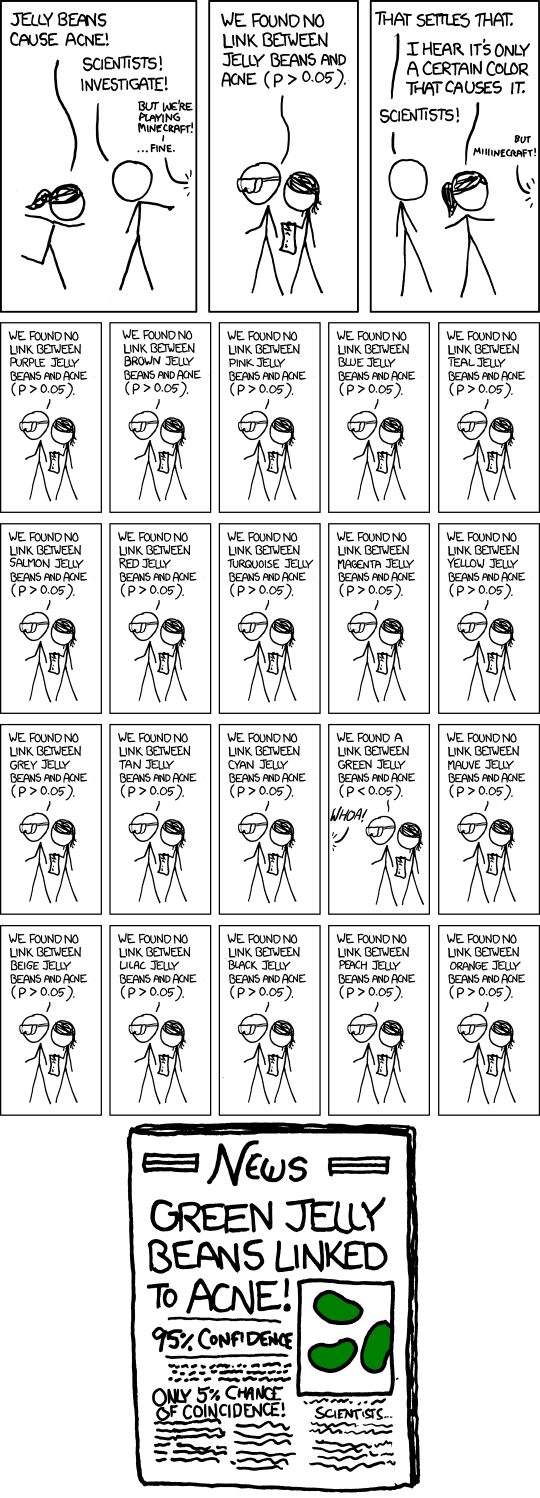
Sometimes, however, a study may try to find not-so-obvious relationships by diving into subgroups of the sample. This zooming in can detect interesting associations, but it also increases the risk of finding statistical artefacts as the sample size decreases. Thus, a headache drug that has not shown effectiveness in 10,000 patients might do so if we look only at Caucasian men aged 18-36, without necessarily implying that it works.
This is an example of what is called "torturing the data", a problem summarised by the following xkcd cartoon:
5. Is the sample random?
Randomisation is one of the most important parts of a study. When it is not achieved, it leads to so-called selection bias, which can distort the results. Obtaining a random sample is a challenge for the design of a study and is not always easy.
For example, if we want to know what percentage of Spaniards are Real Madrid fans, we will not obtain the same results if we do a telephone survey throughout the country as if we do it in a Madrid supporters' club in the capital.
6. Relative and absolute risks
"Taking ibuprofen increases the risk of heart attack by 50%. "People who have passed covid-19 are 60% more likely to be diagnosed with Alzheimer's". It is common to read such headlines in the media, the percentages of which can be cause for alarm. The question is: 50% or 60% more likely for what?
These percentages are high because they refer to relative risk, but they don't say much if we don't know the absolute risk: a low risk will still be low, even if it increases a lot. For example, it is not the same if a drug reduces the risk of death by 20% to 10% as if it reduces it by 0.2% to 0.1%. Even so, in both cases the relative risk has been reduced by 50%.
Keeping this in mind when communicating is important to avoid giving the message that a drug is more effective or dangerous than it really is. You can read more on this topic in our resource on risk communication.
7. Beware of assuming causality: the danger of observational studies and confounding factors
Let's imagine we conducted a study of thousands of people and asked them if they slept the night before with their shoes on and if they woke up the next morning with a headache. The results show unequivocally that people who go to sleep without taking off their shoes tend to wake up with a headache.
It would be appealing to conclude that getting into bed with shoes on causes headaches. However, it could be that the authors of the study had forgotten a confounding factor responsible for the headache: that people who have drunk a lot of alcohol are more likely to get into bed in their clothes and shoes.
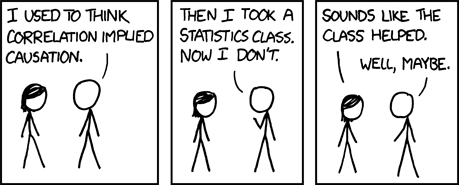
The example is taken from the podcast Inaplicables, which discusses the difficulty of concluding causality in science, however appealing it may be. "Correlation does not imply causation" is a phrase that is already repeated uncritically, but it is essential to bear in mind.
Observational studies - like the made-up example of shoes and hangovers - are those in which the researcher does not manipulate any factors, but simply measures the variables of interest in different populations or individuals. They are very common because they are easier to conduct, but have the limitation that they do not allow causality to be extracted.
8. Sometimes it is not necessary to penetrate the black box
University of Washington biologist Carl Bergstrom compares the statistics of a study to a black box whose interior we cannot elucidate in his book Bullshit: Against Quackery. Before blinding ourselves with confidence intervals, p-values and ANCOVA tables, it might be a good idea to read the results with some scepticism and common sense.
"Generally, we don't have to open the black box to be able to label the claims it generates as bullshit," says Bergstrom. This is particularly useful advice when confronted with a study that makes extraordinary claims.
For example, you don't have to have a PhD in statistics or hand-check the calculations to suspect that a study claiming that cabbage consumption is associated with lower covid-19 mortality cannot prove causality between the two phenomena.